
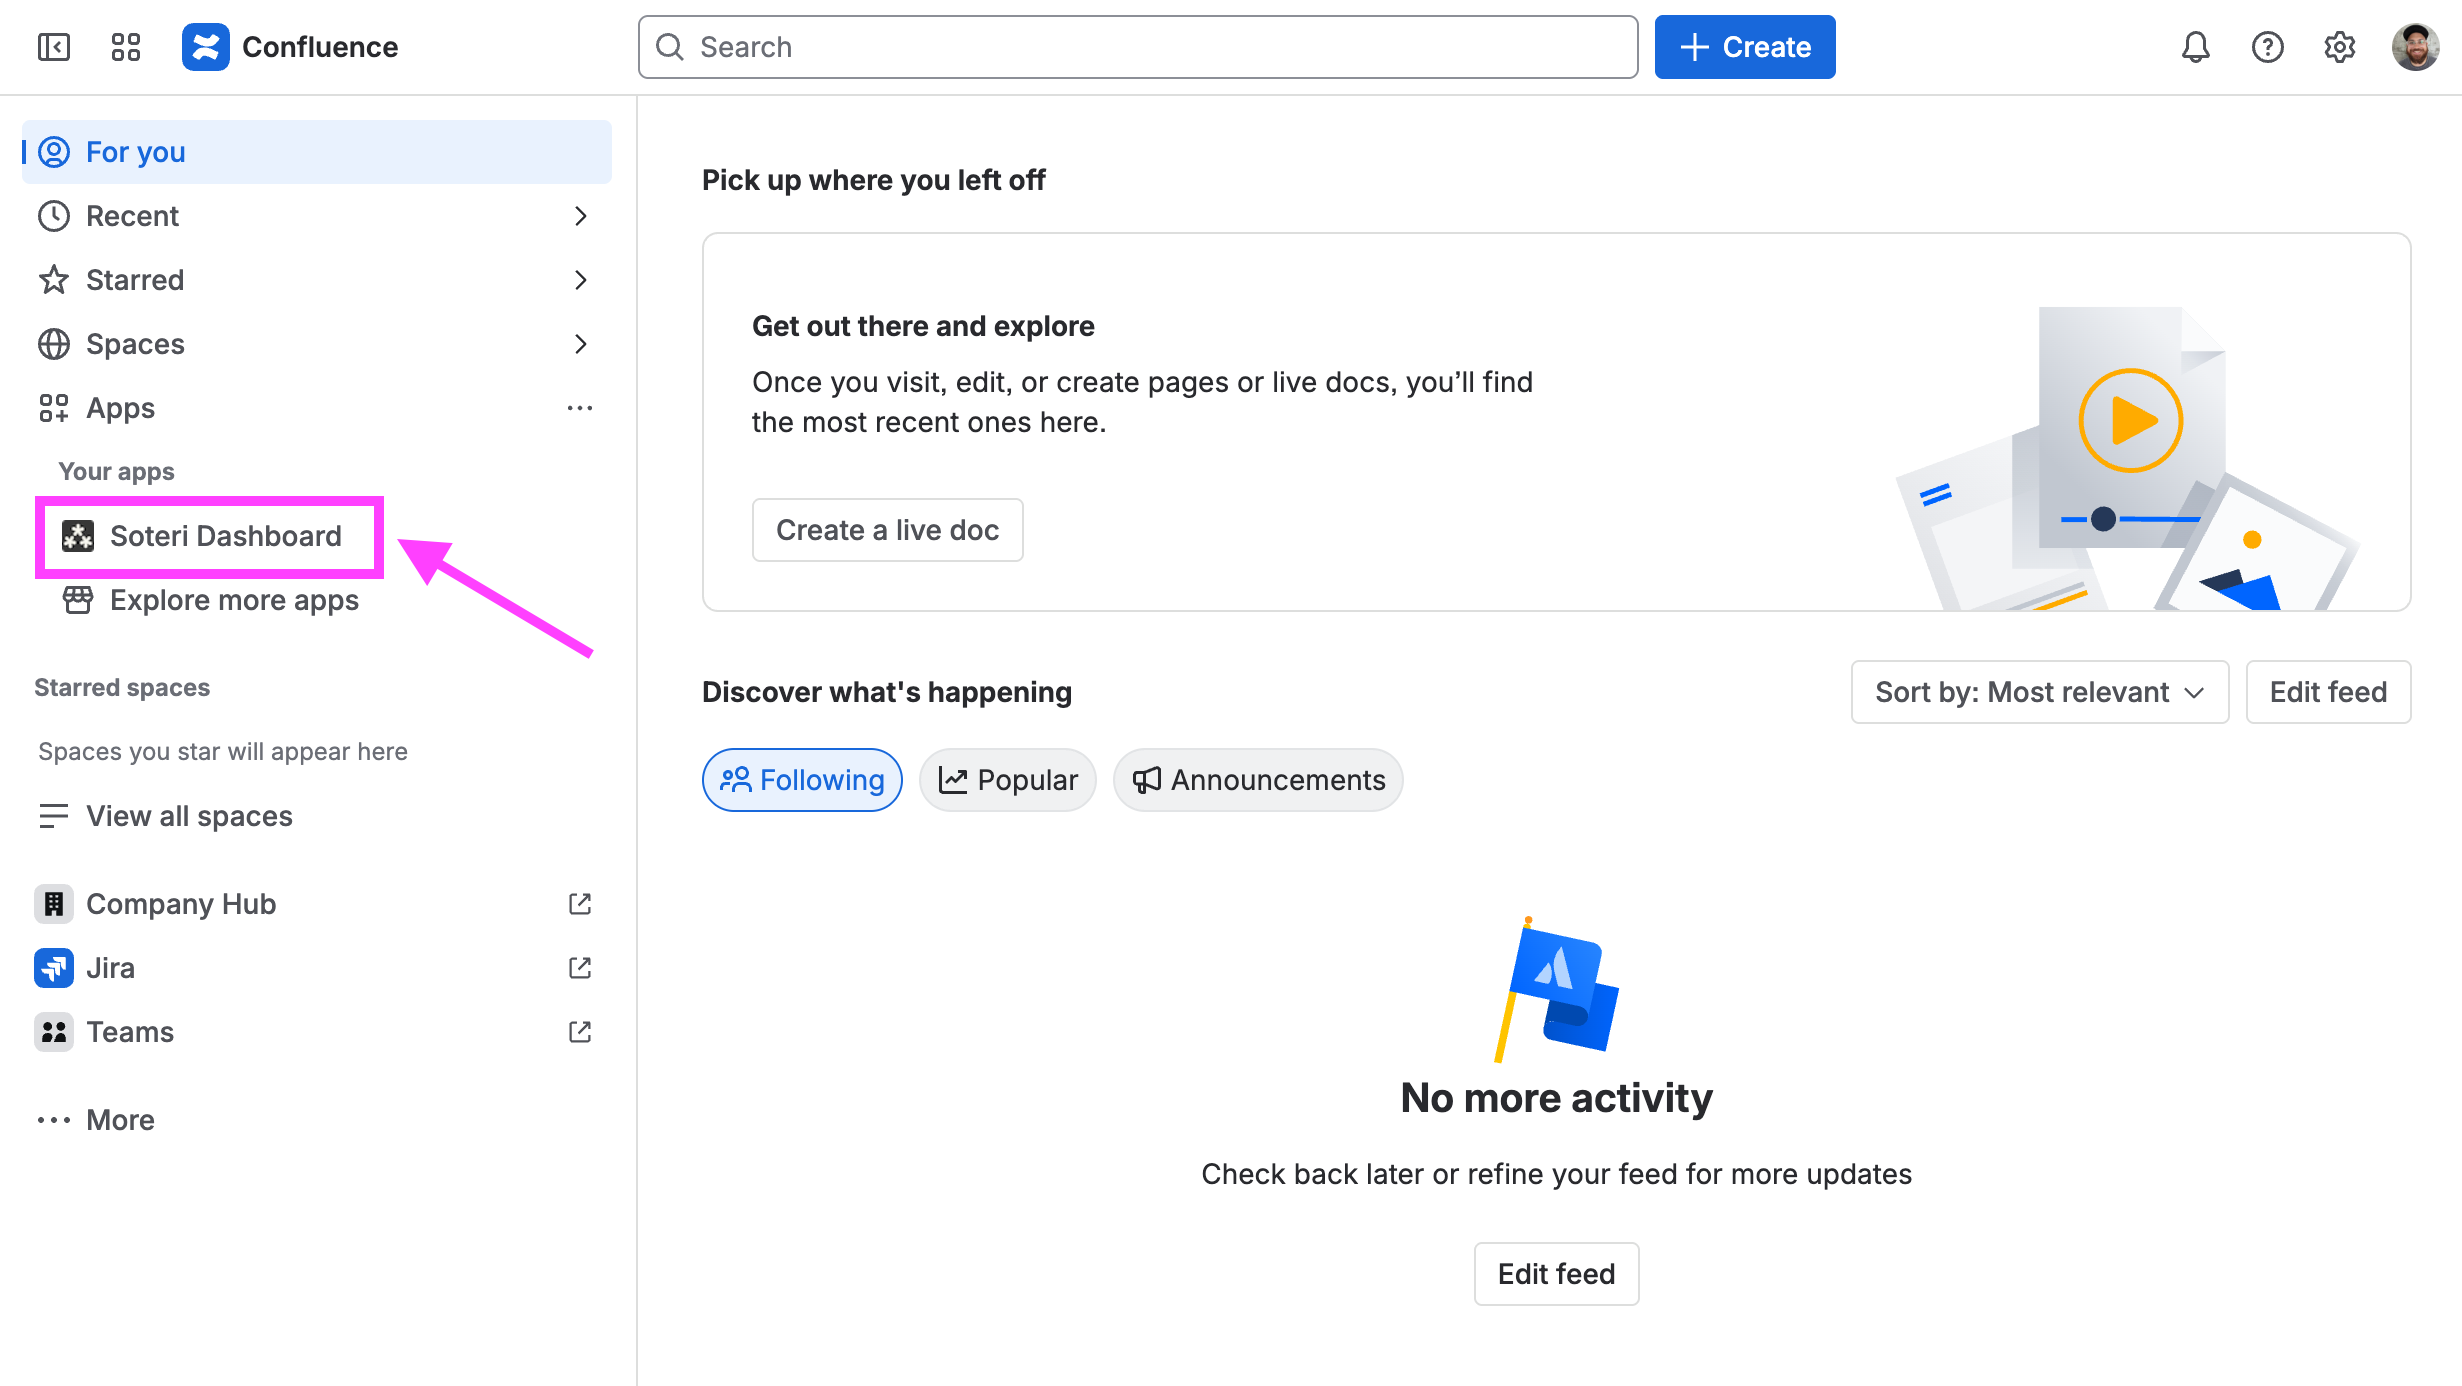
The Soteri Dashboard allows users to view the scan statuses of all Confluence spaces they can administer. It can be accessed by clicking the link in the Apps menu:
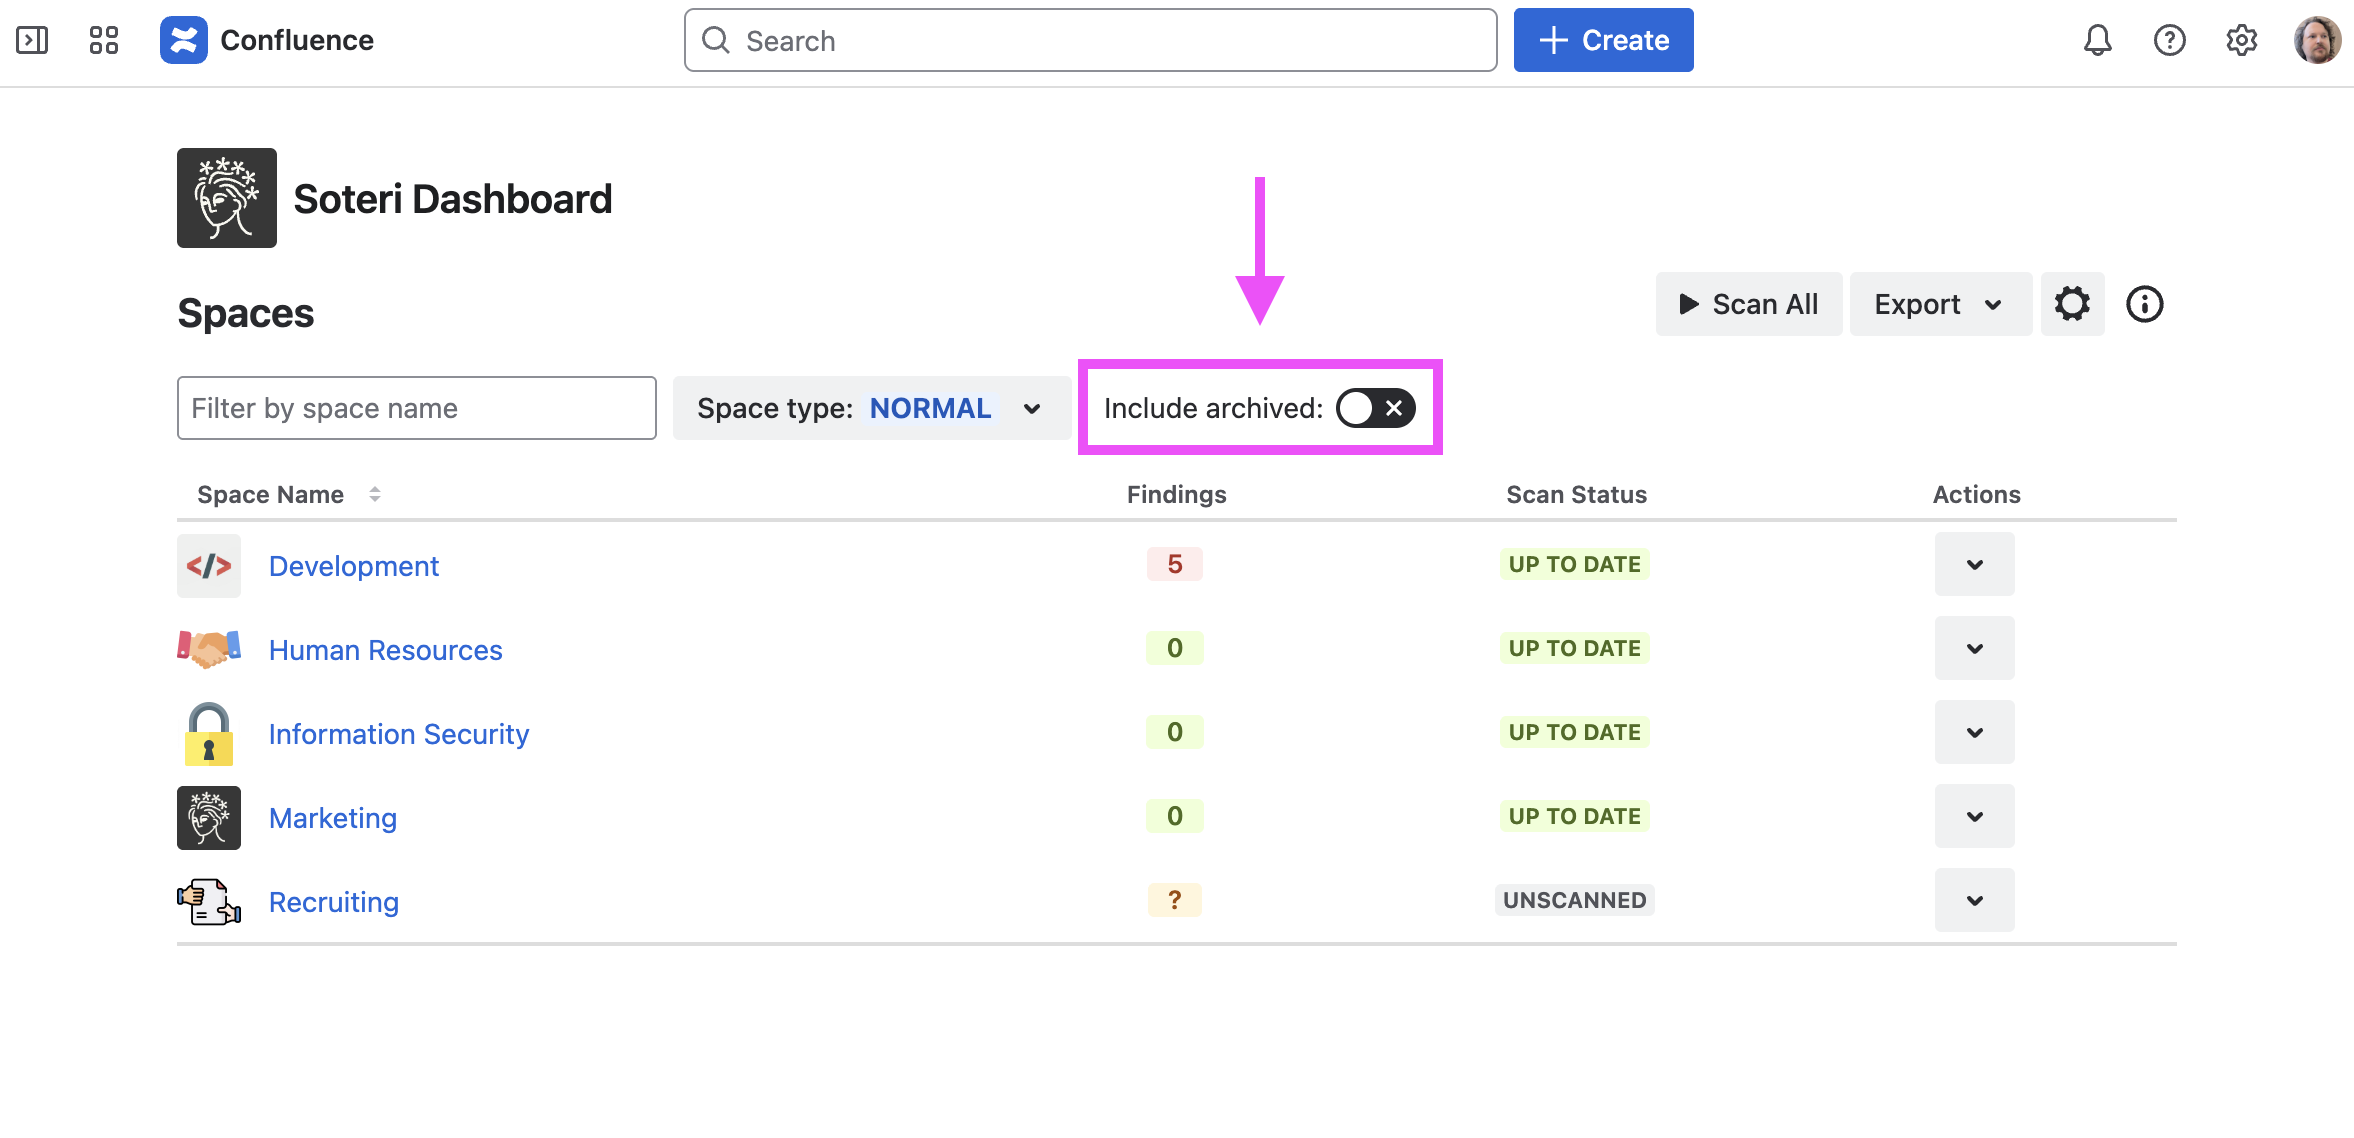
Each space will appear, along with the following:
-
The number of findings found in that space.
-
The scan’s status. This can be:
-
Up To Date: The space has been fully scanned and either has the Security Hook enabled to scan all future content, or no changes have been made to the space since it was last scanned.
-
Outdated: The space has been fully scanned, but changes have been made since that happened.
-
Settings Changed: The configured scanning rules have changed since the last time this space was scanned.
-
Scheduled / Scanning: A scan of the space is in progress.
-
Unscanned: The space has not been scanned.
-
Scan Error: An error occurred during the last space scan that prevented it from completing successfully.
-
-
A dropdown menu of actions you can perform for that space.
Note that the finding count does not include any findings which have been reviewed.
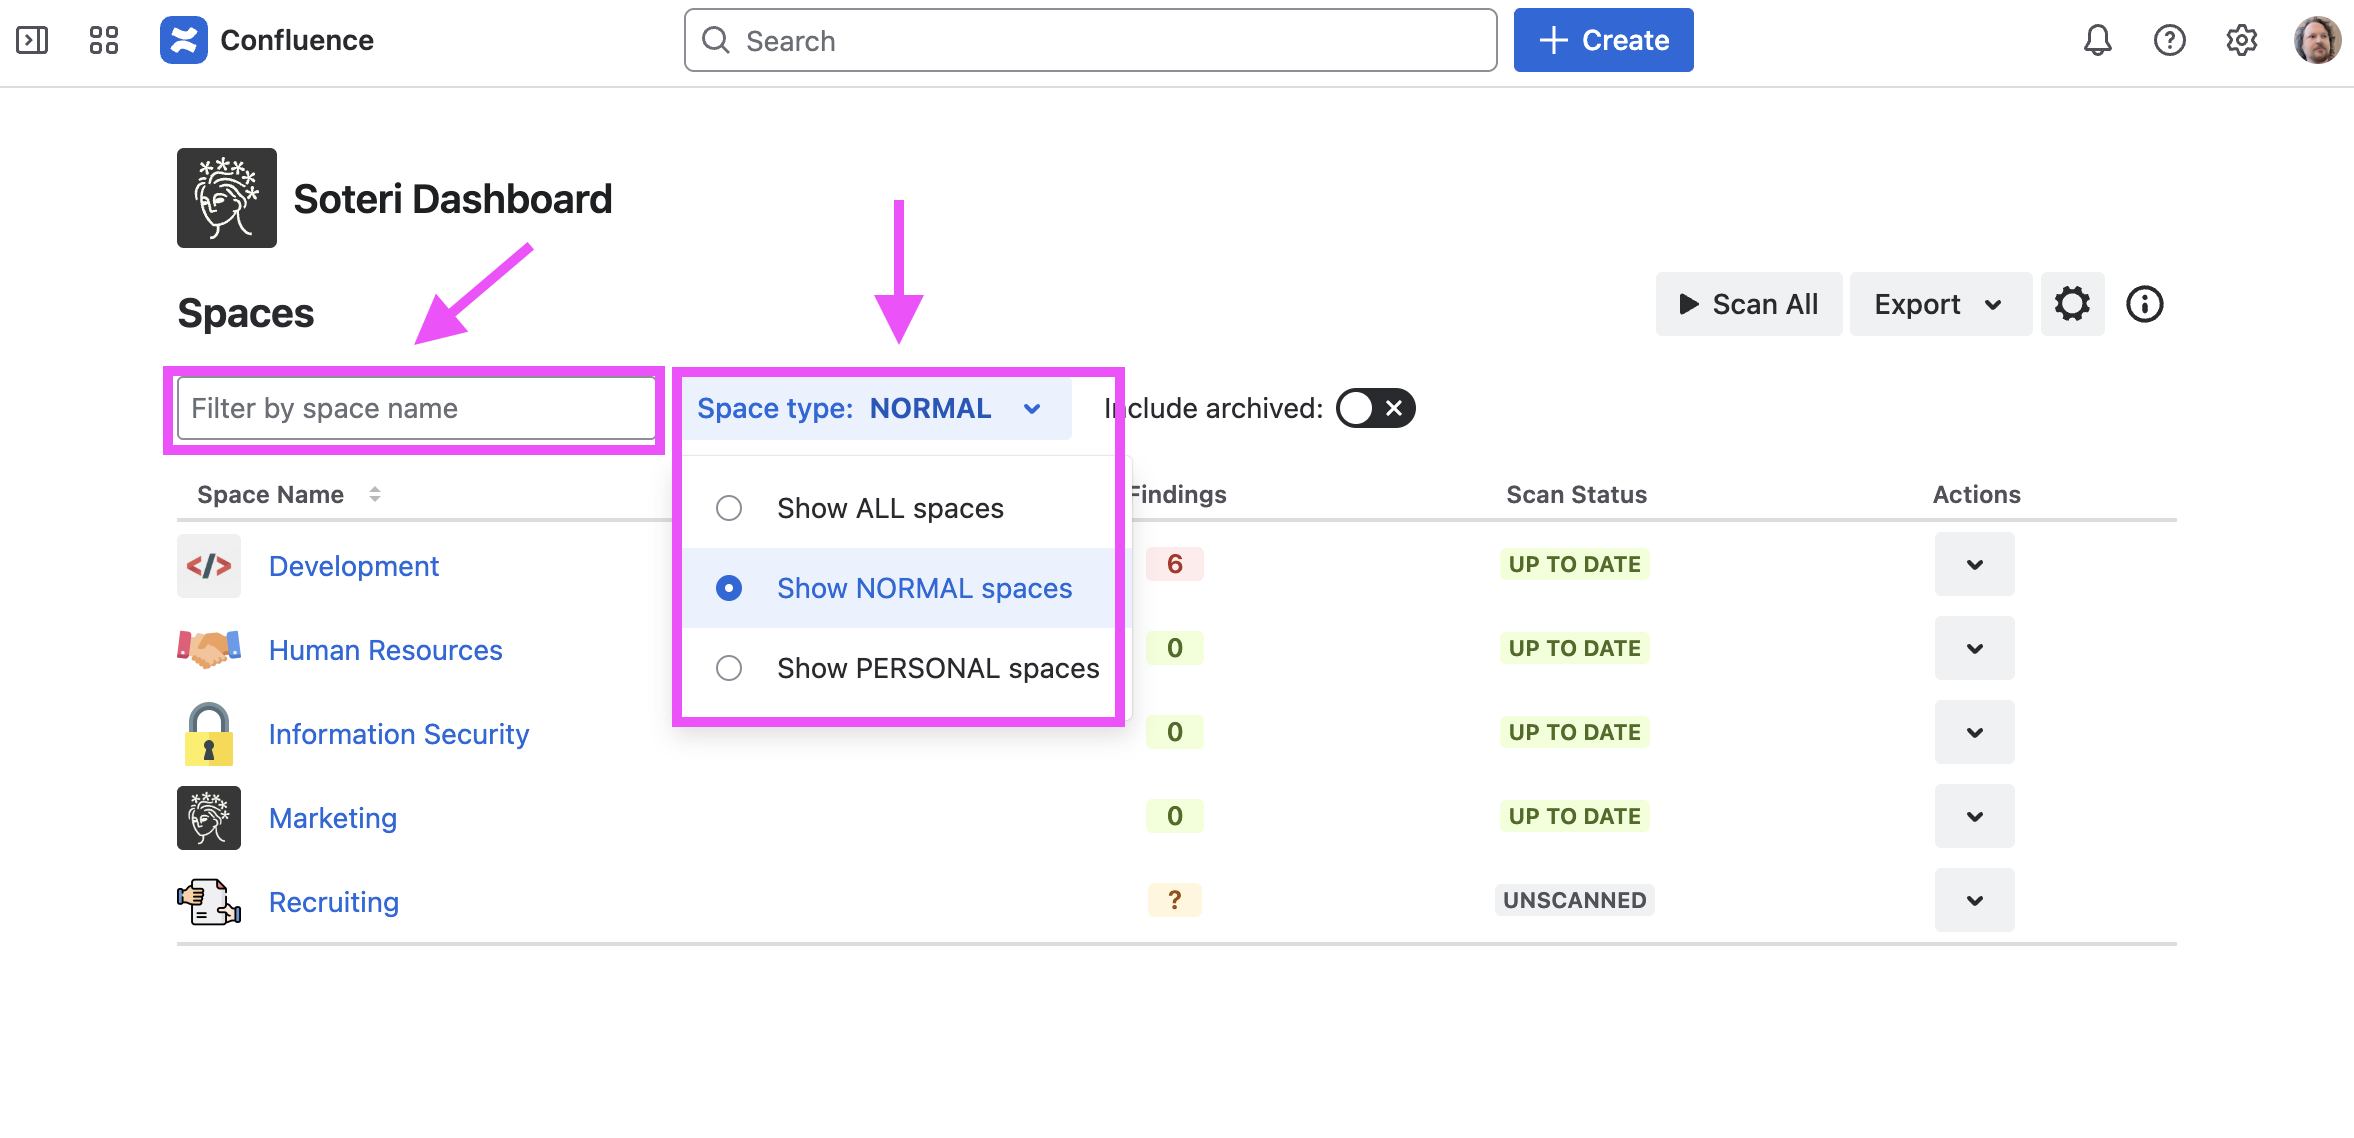
You can use the provided “Filter by space name” input to search for particular spaces, and the “Space type” dropdown to view normal spaces, private spaces, or both (the default).
Clicking on the gear icon in the upper right will take you to the Security for Confluence Settings page.
Triggering Scans for an Individual Space
Clicking on a space’s “Actions” dropdown menu reveals the options “Scan” and “Export”:
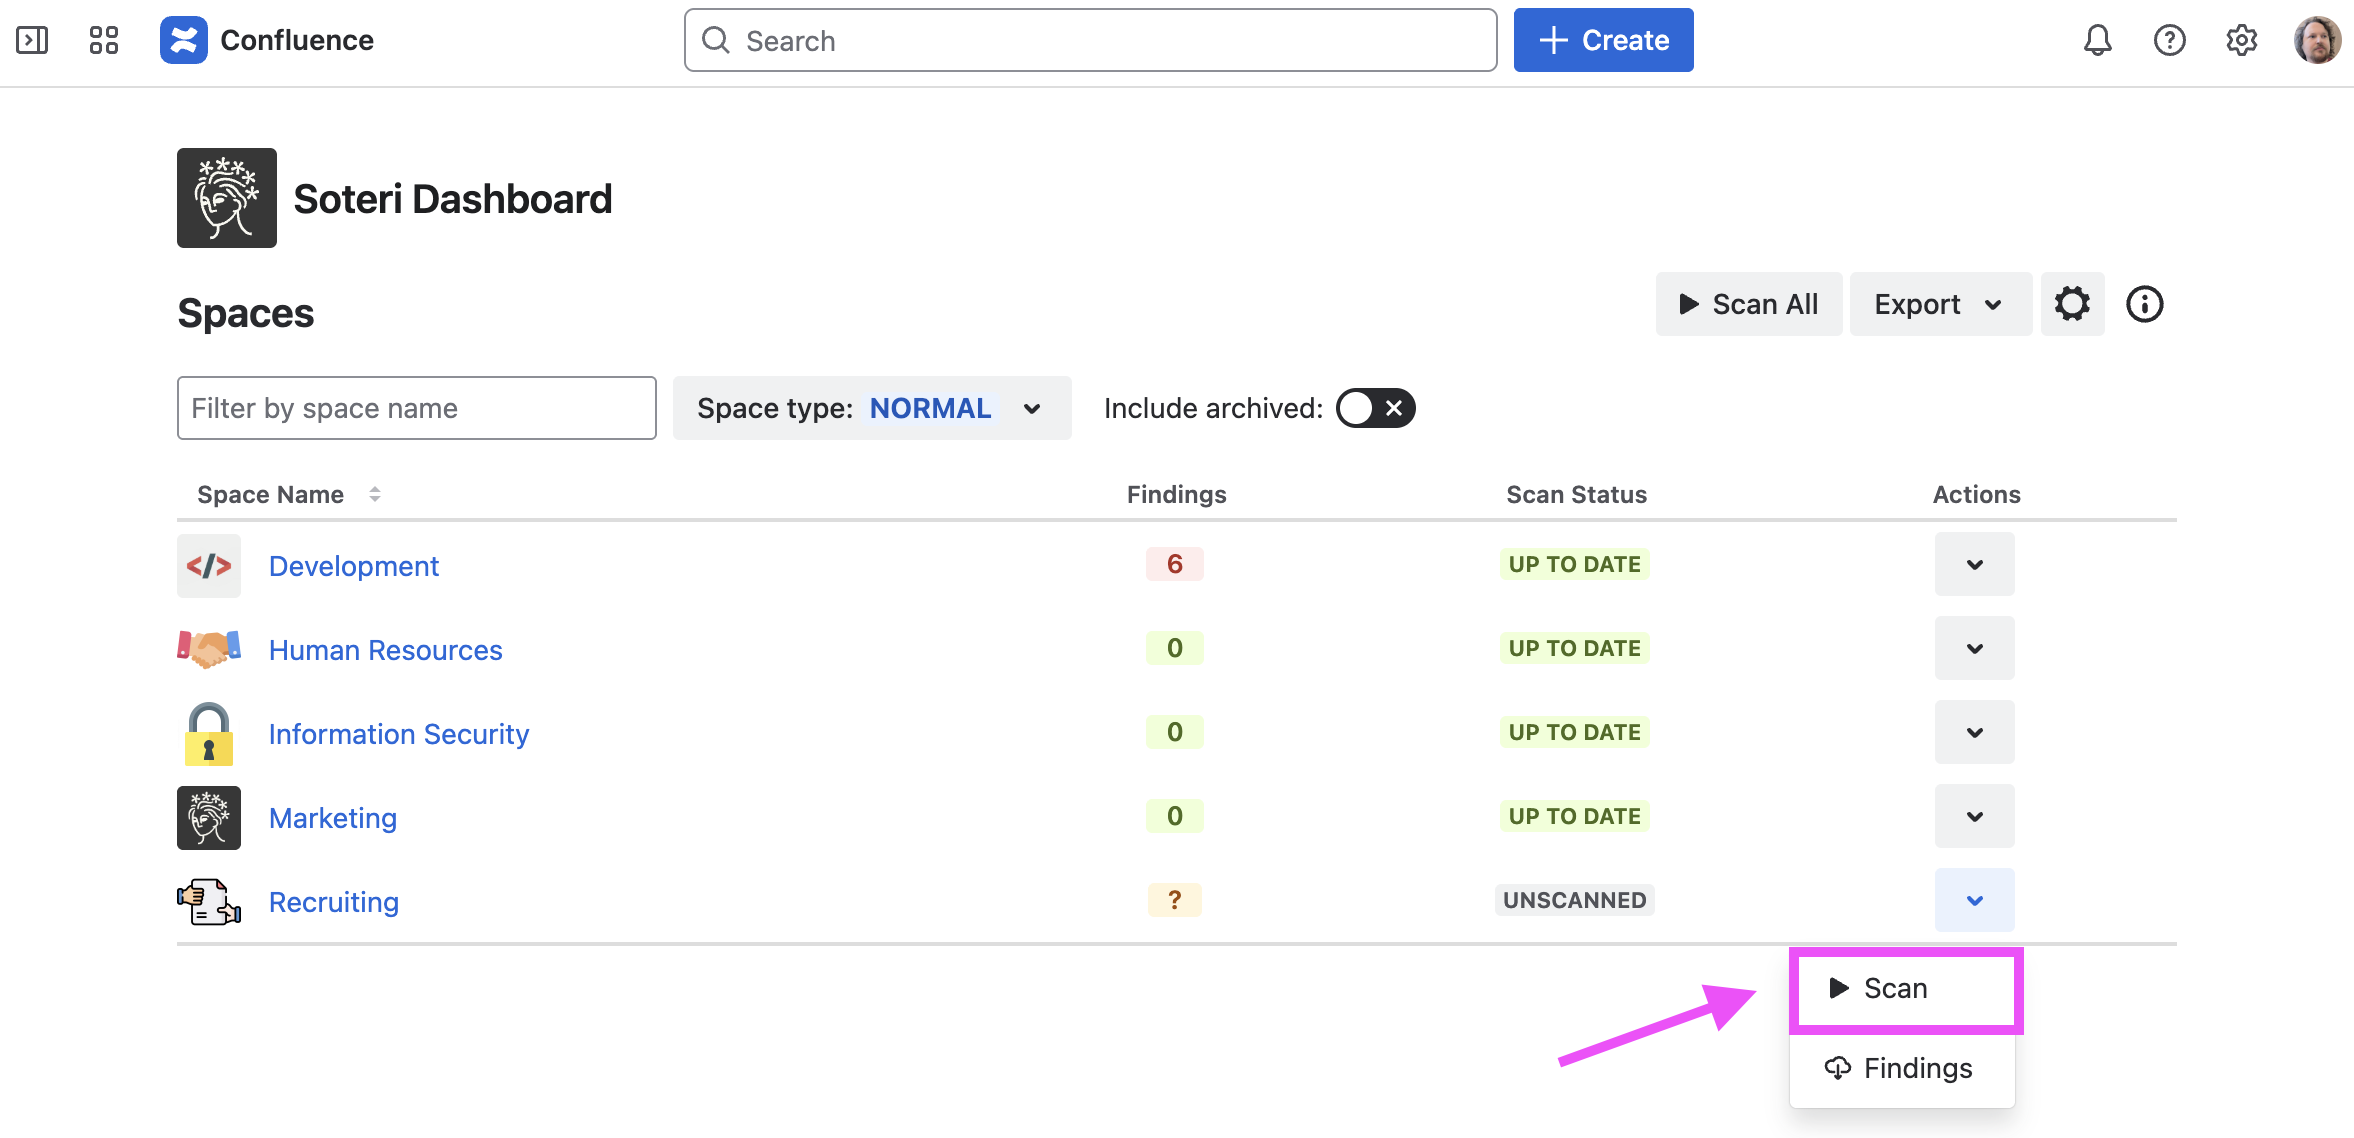
Choosing “Scan” will trigger a scan for new and modified content in that space. Choosing “Export” will download a list of all findings for that space in CSV format. Read more about exports here.
Clicking on a space’s name in the Soteri Dashboard will take you to that space’s Security Analysis, where you can trigger scans on a per-page basis.
If any vulnerabilities are found, we recommend following our advice here.
Triggering Scans for All Spaces
Confluence administrators will see the Scan All button on the Dashboard.
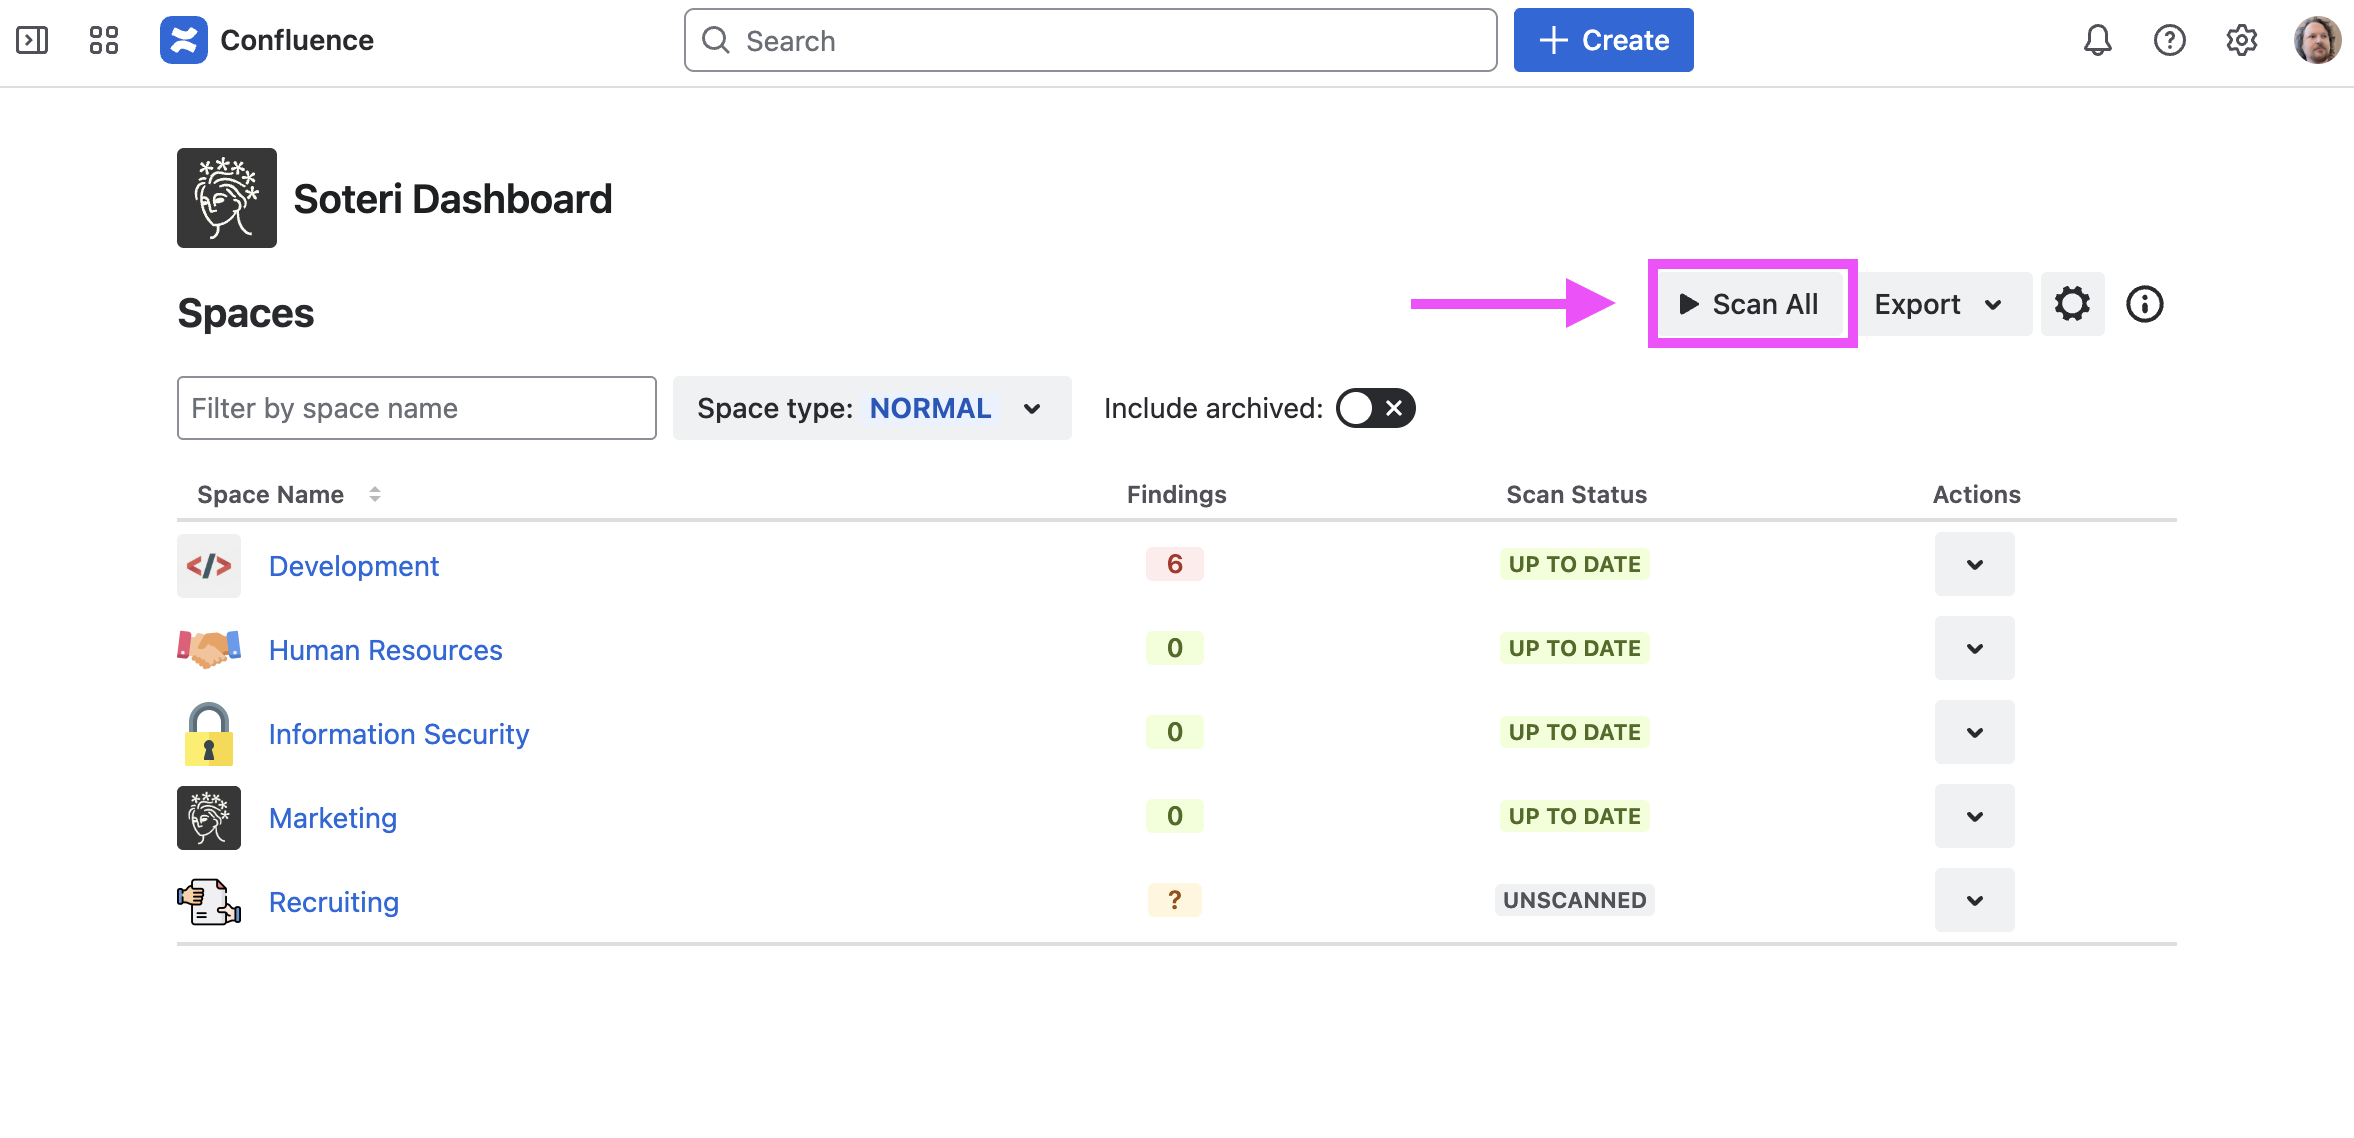
Clicking this button will trigger scans for your entire Confluence Cloud instance, both normal and personal spaces. You can see scan progress by refreshing the dashboard page.
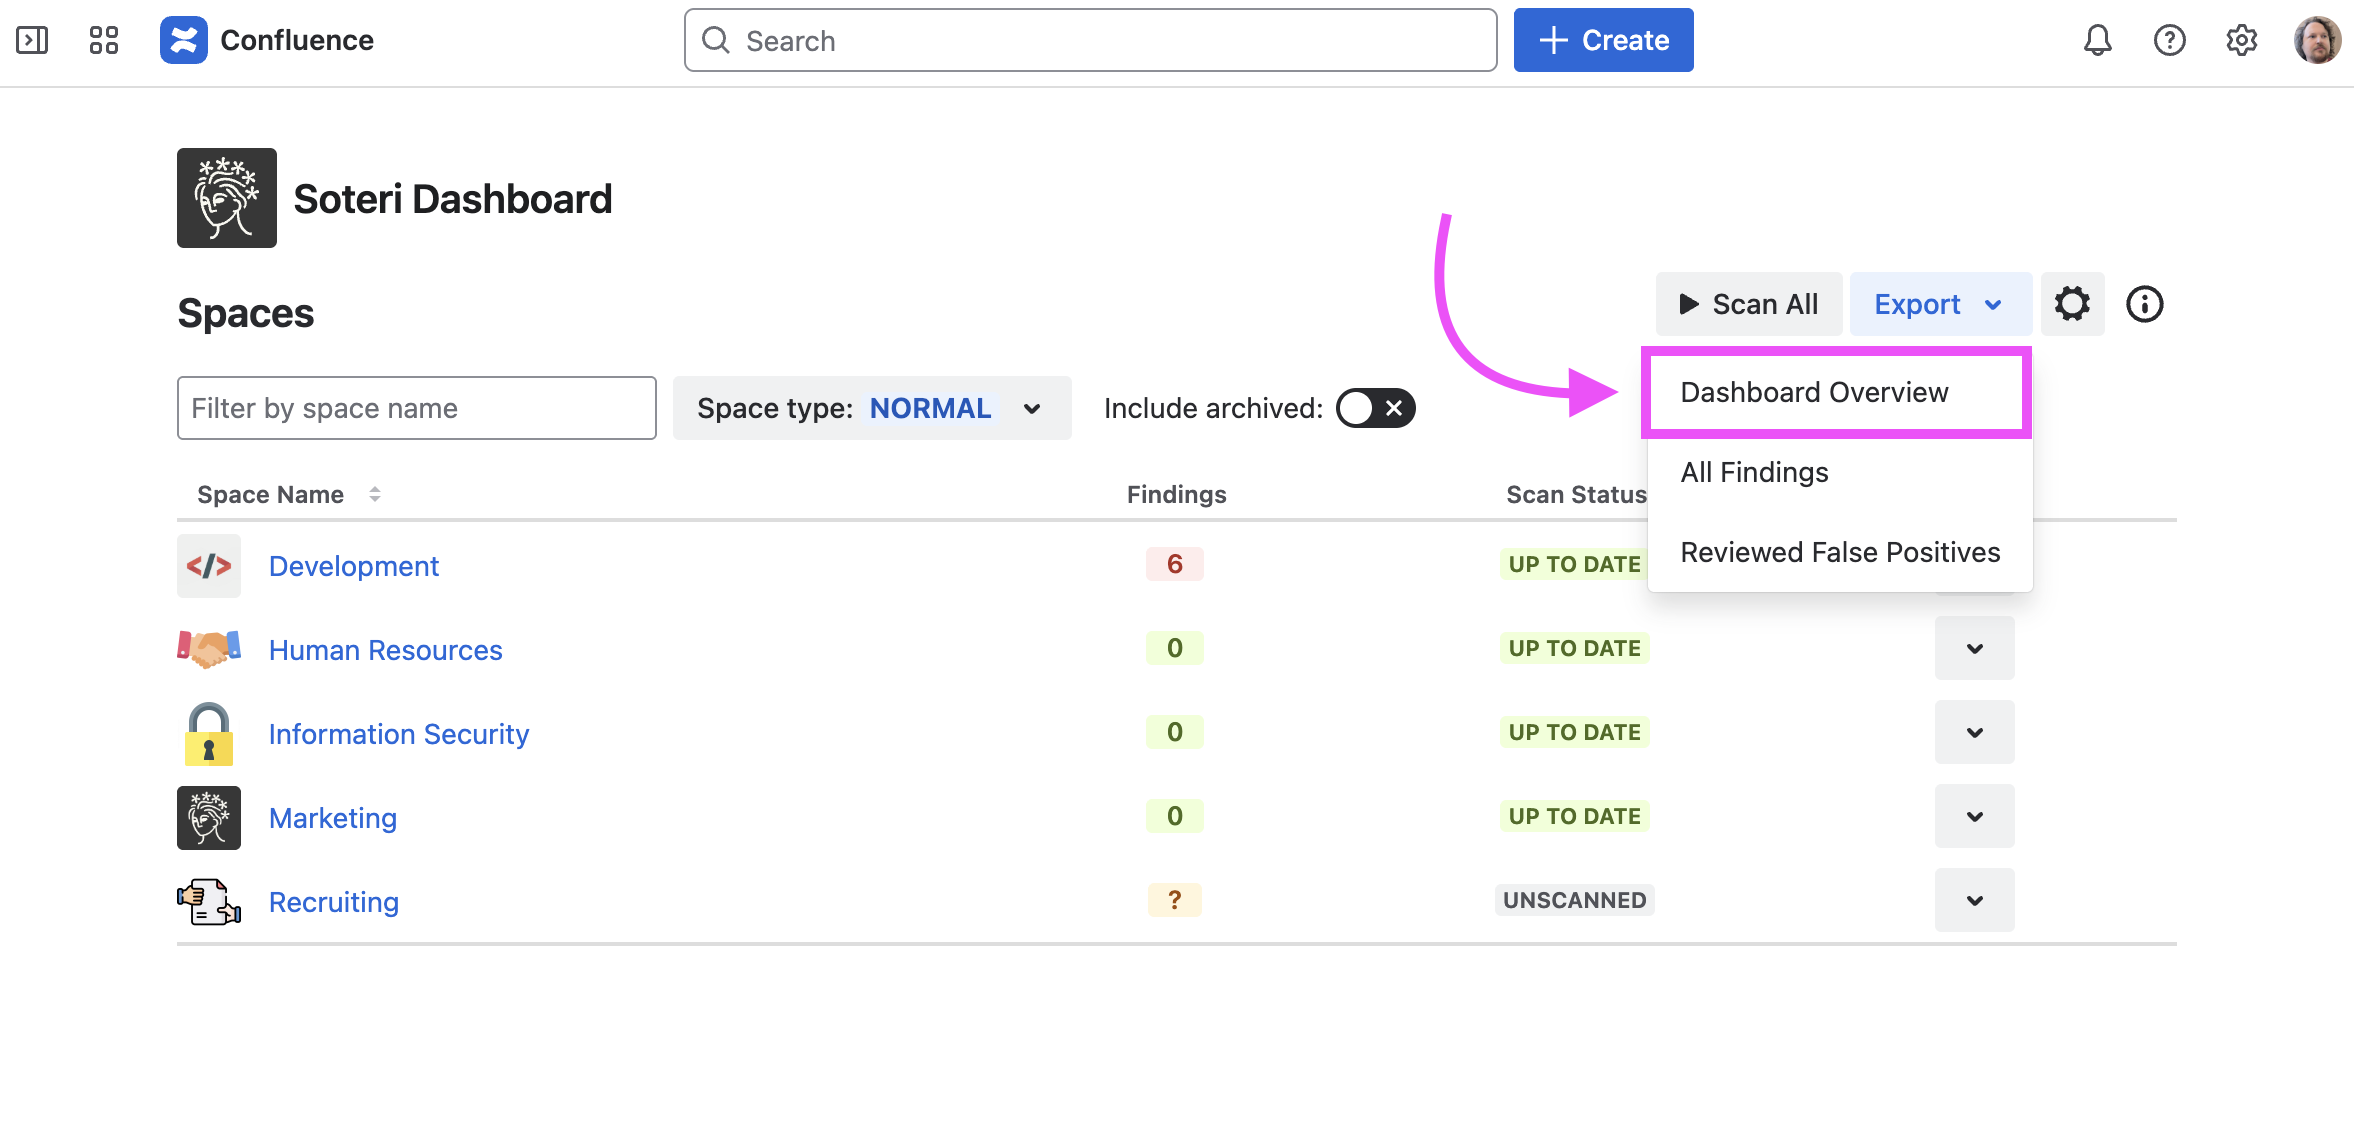
Exporting the dashboard overview
Security for Confluence allows users to export the list of spaces visible on the dashboard together with their individual scan status, up to date status, and the number of unreviewed findings in that space.
Filters
Spaces can be filtered by name and/or by type. Neither of these affect the exports.
Archived spaces are hidden by default, but may be toggled on. This setting does affect the exports.