
The Soteri Dashboard allows users to view the scan statuses of all Jira projects they administer. It can be accessed from anywhere within Jira by clicking the padlock icon at the top-right of the screen:
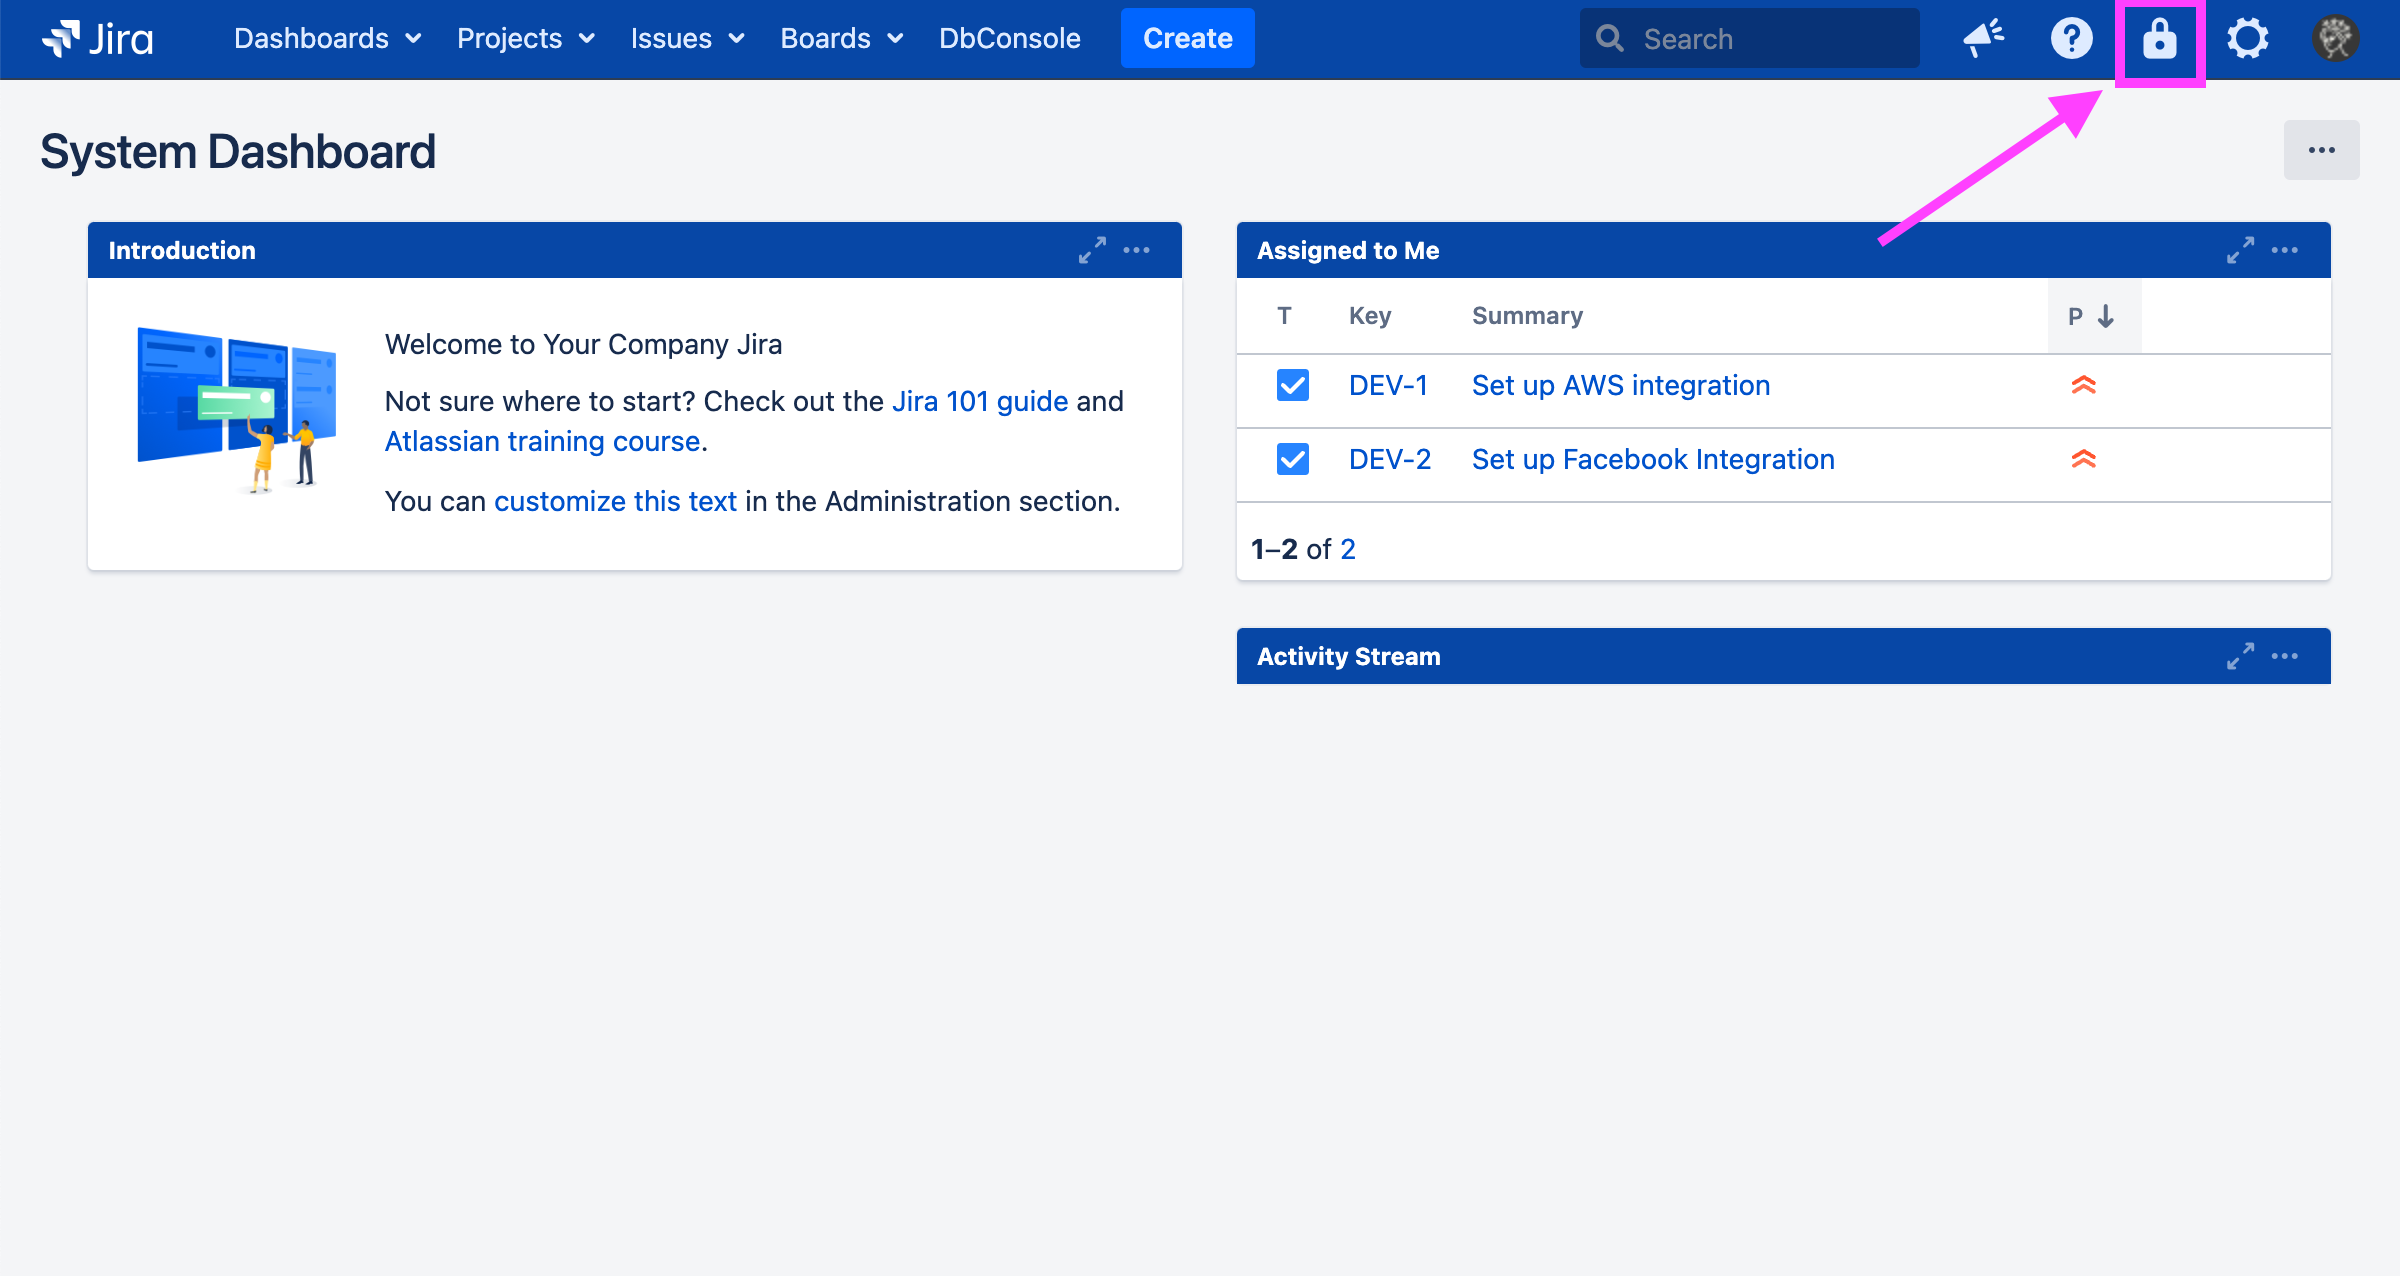
Here is an example:
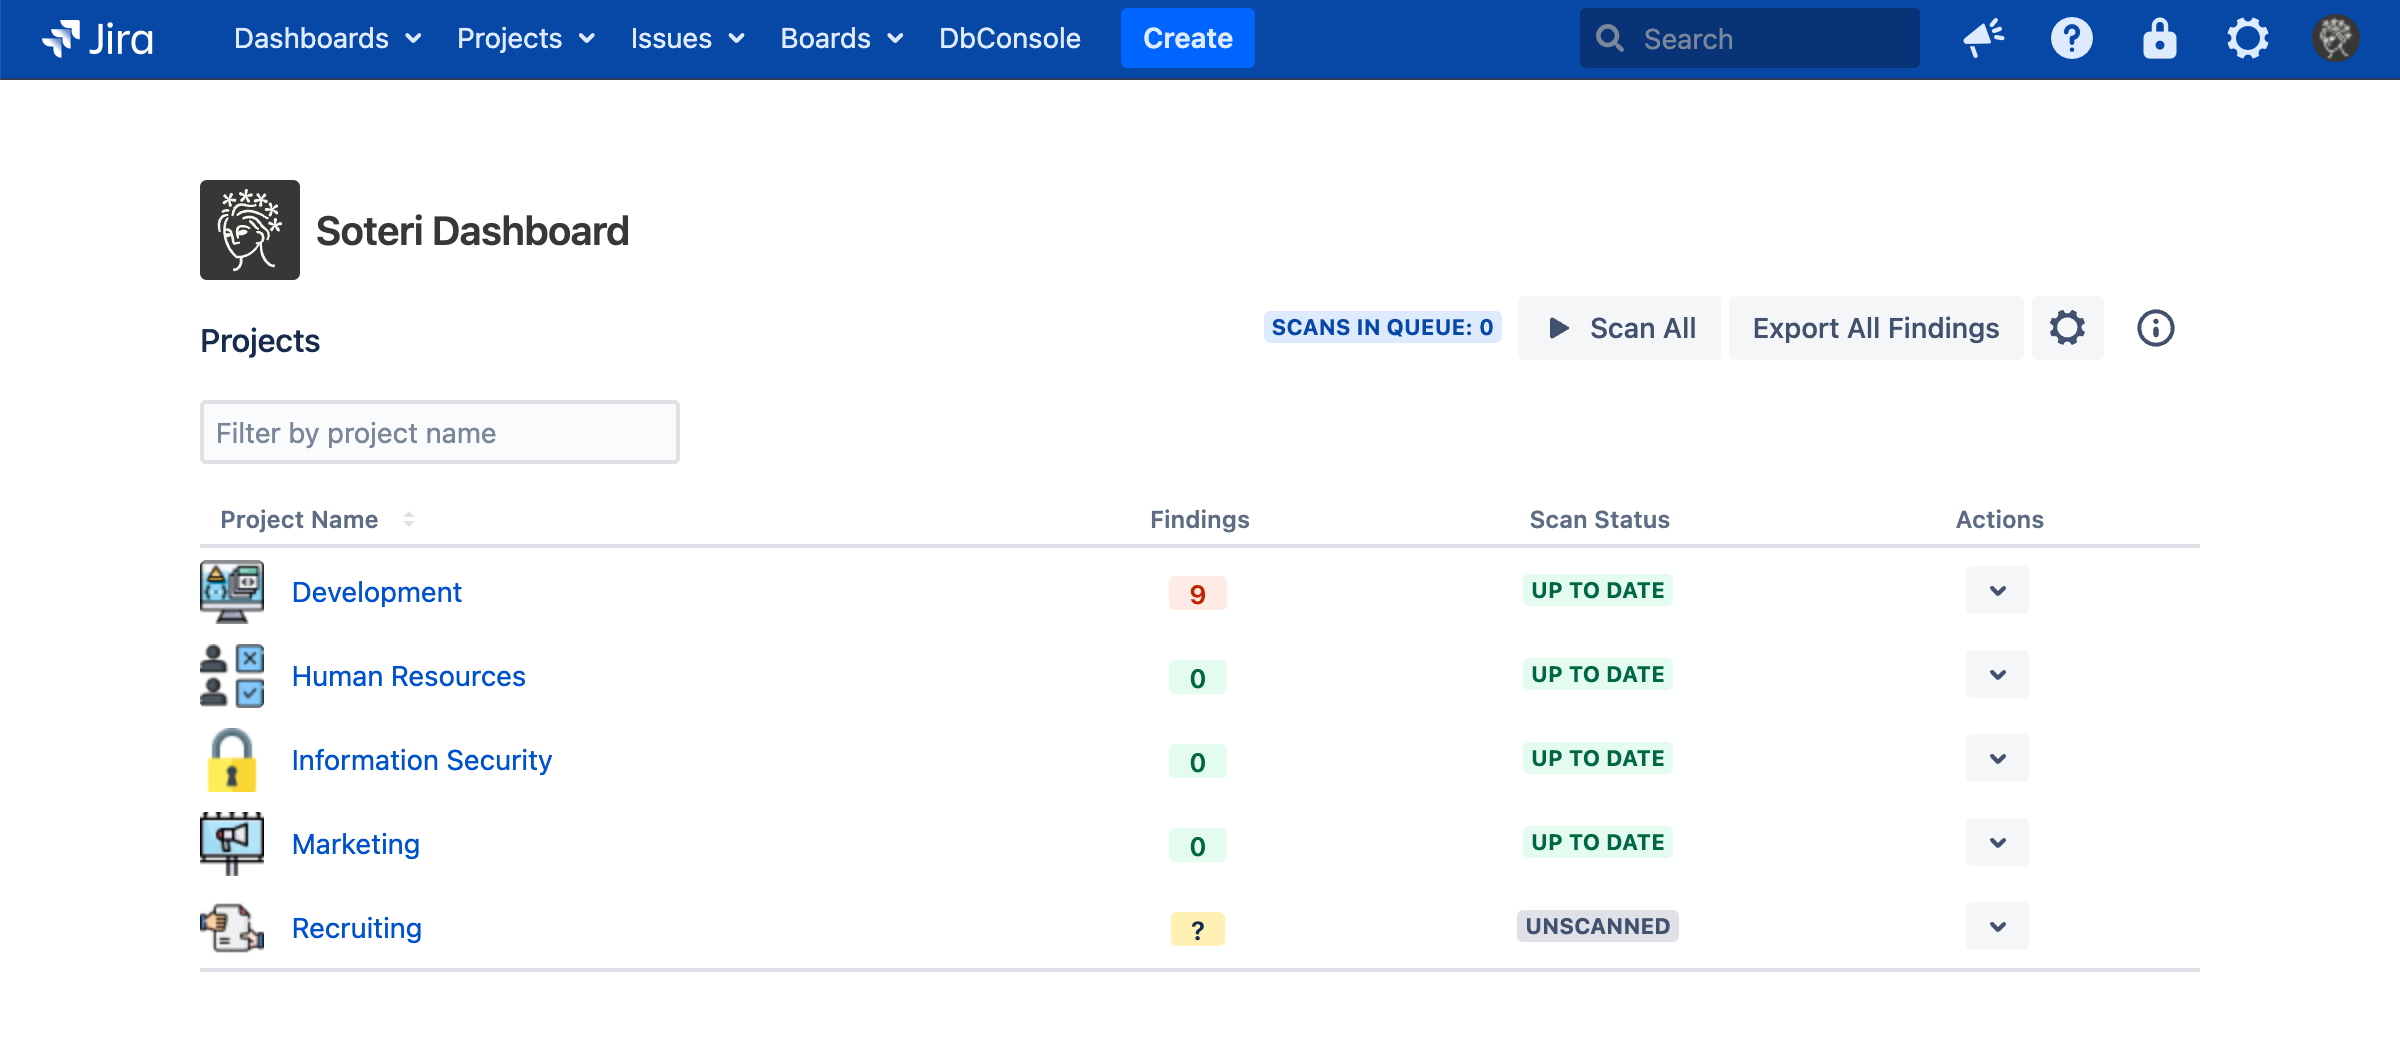
Each project will appear, along with the following:
-
The number of scan findings in that project.
-
The scan’s status. This can be:
-
Up To Date: The project has been fully scanned and either has the Auto Scan Hook enabled to scan all future content, or no changes have been made to the project since it was last scanned.
-
Outdated: The project has been fully scanned, but changes have been made since that happened.
-
Scanning: A scan of the project is in progress.
-
Unscanned: The project has not been scanned.
-
Scan Error: There was an issue doing a scan of this project. Click the project name to learn more.
-
-
A dropdown menu of actions you can perform for that project.
Note that the findings count does not include any findings which have been reviewed.
You can use the provided “Filter by project name” input to search for particular projects.
Clicking on the gear icon in the upper right will take you to the Security for Jira Settings page.
Triggering Scans for an Individual Project
Clicking on a project’s “Actions” dropdown menu reveals the options “Scan” and “Export”:
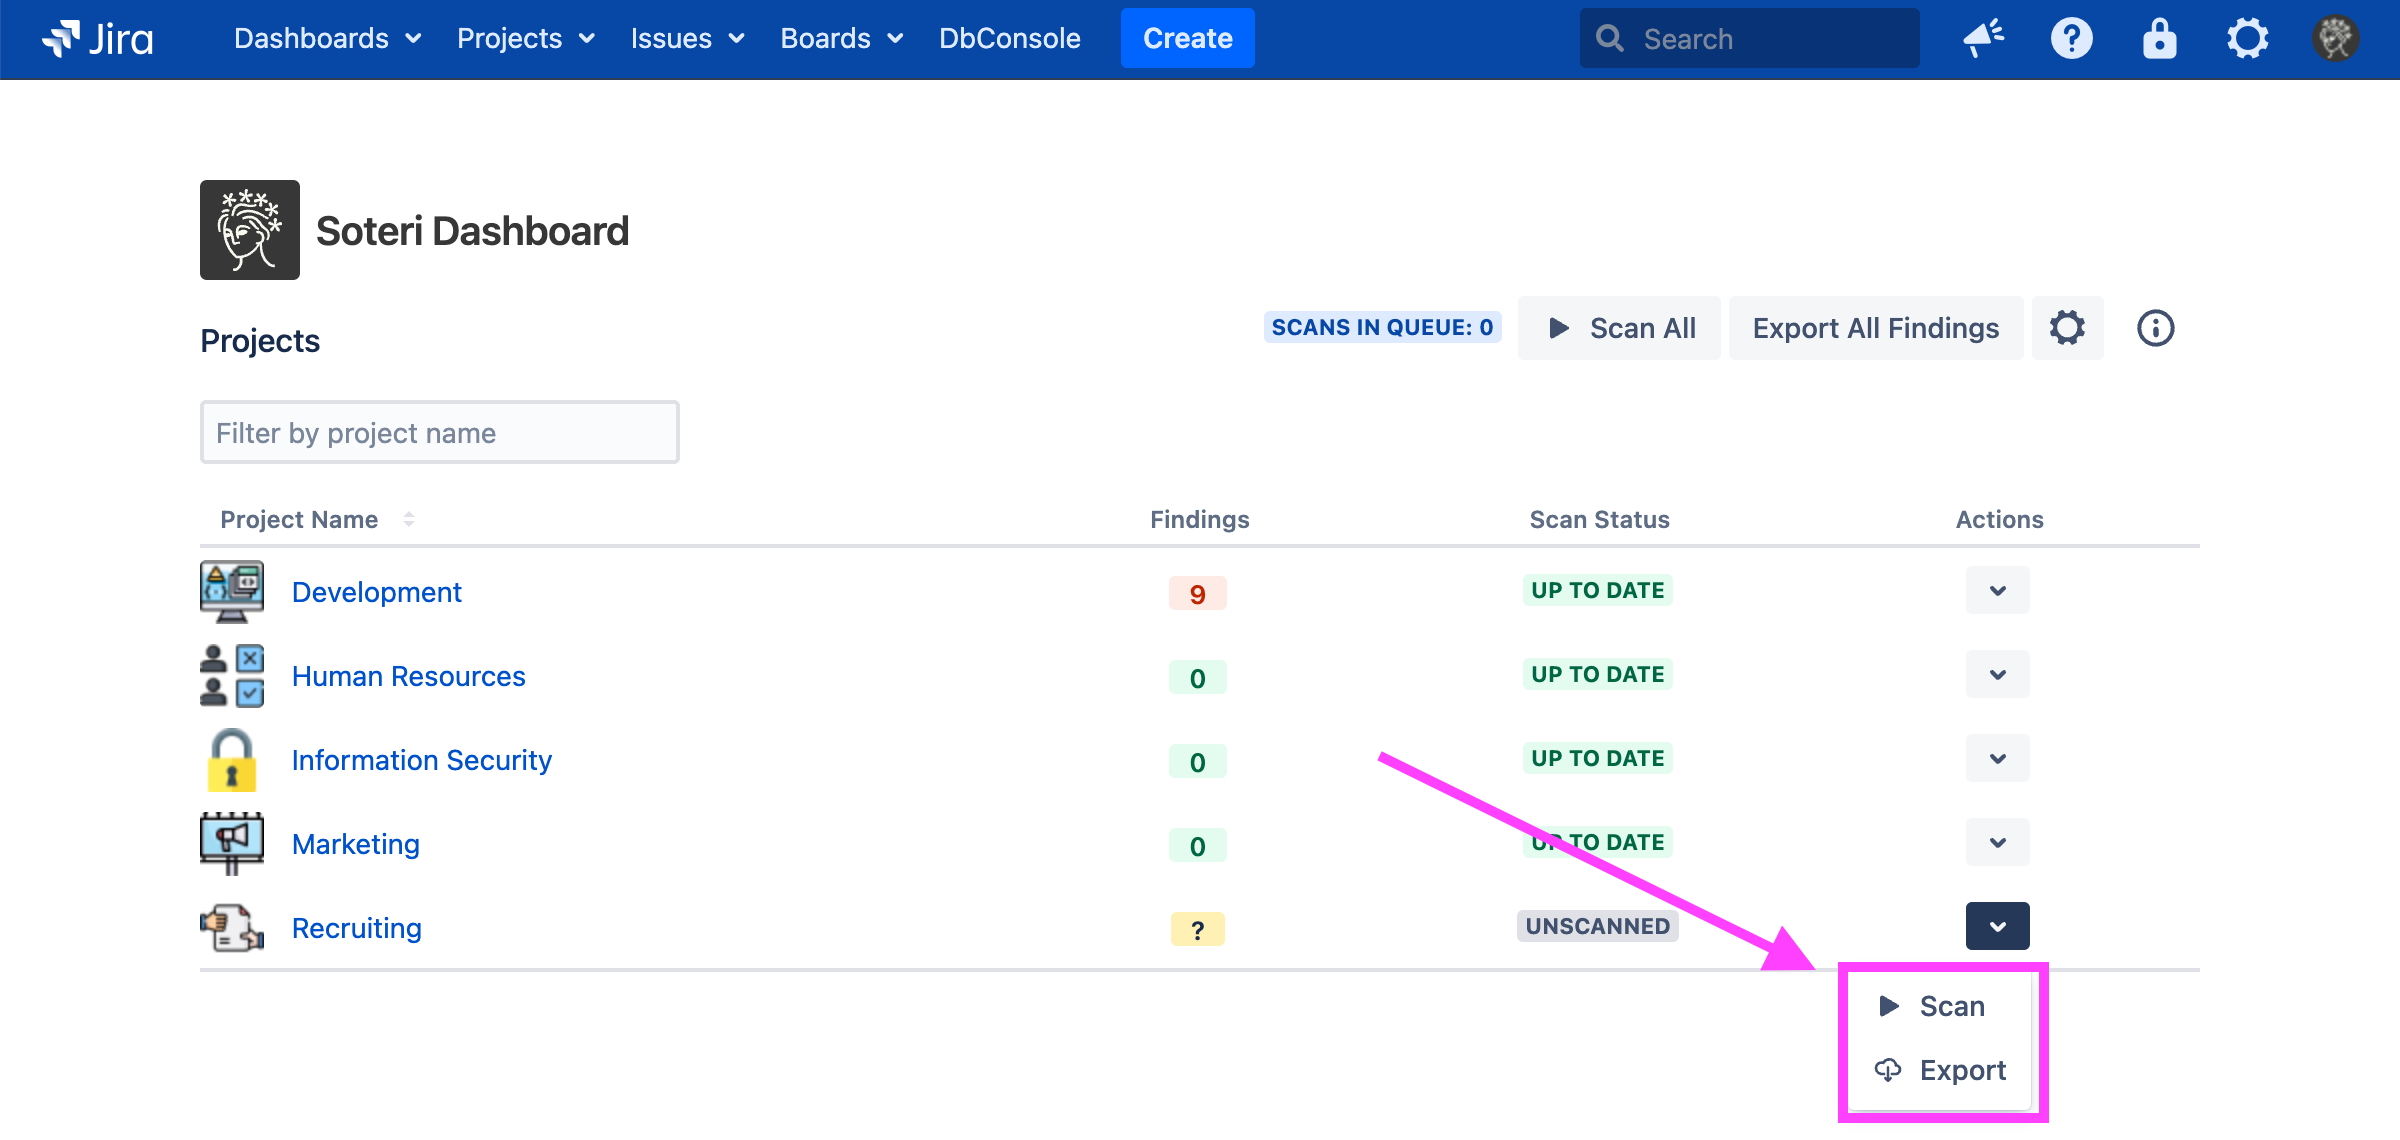
Choosing “Scan” will trigger a scan for new and modified issues in that project (*** VERIFY). Choosing “Export” will download a list of all findings for that project in CSV format. Read more about exports here.
Clicking on a project’s name in the Soteri Dashboard will take you to that project’s Security Analysis, where you can trigger scans on a per-issue basis.
If any vulnerabilities are found, we recommend following our advice here.
Triggering Scans for All Projects
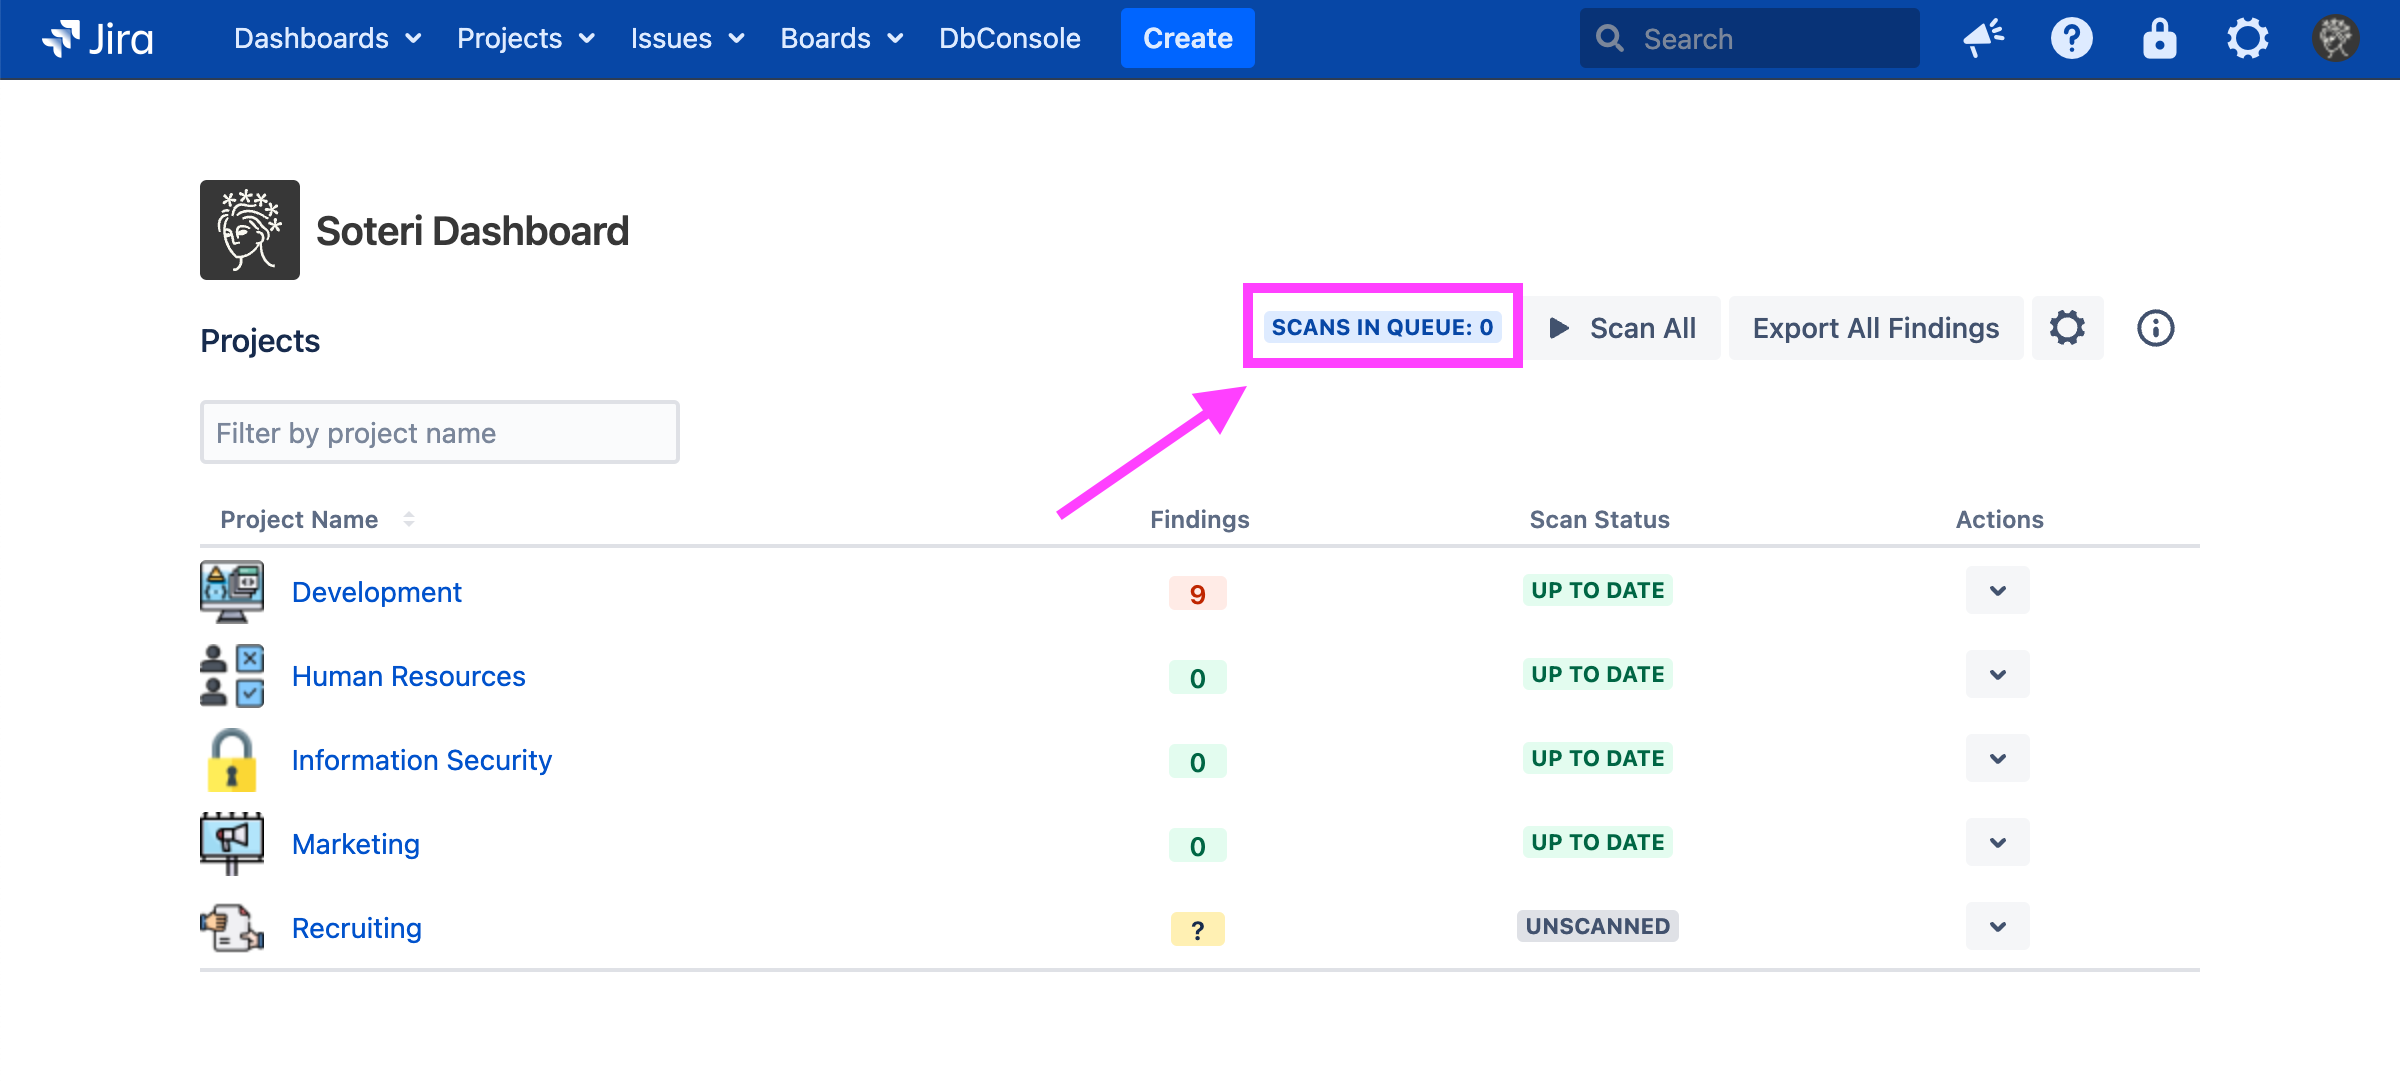
Jira administrators can see the Scan All button.
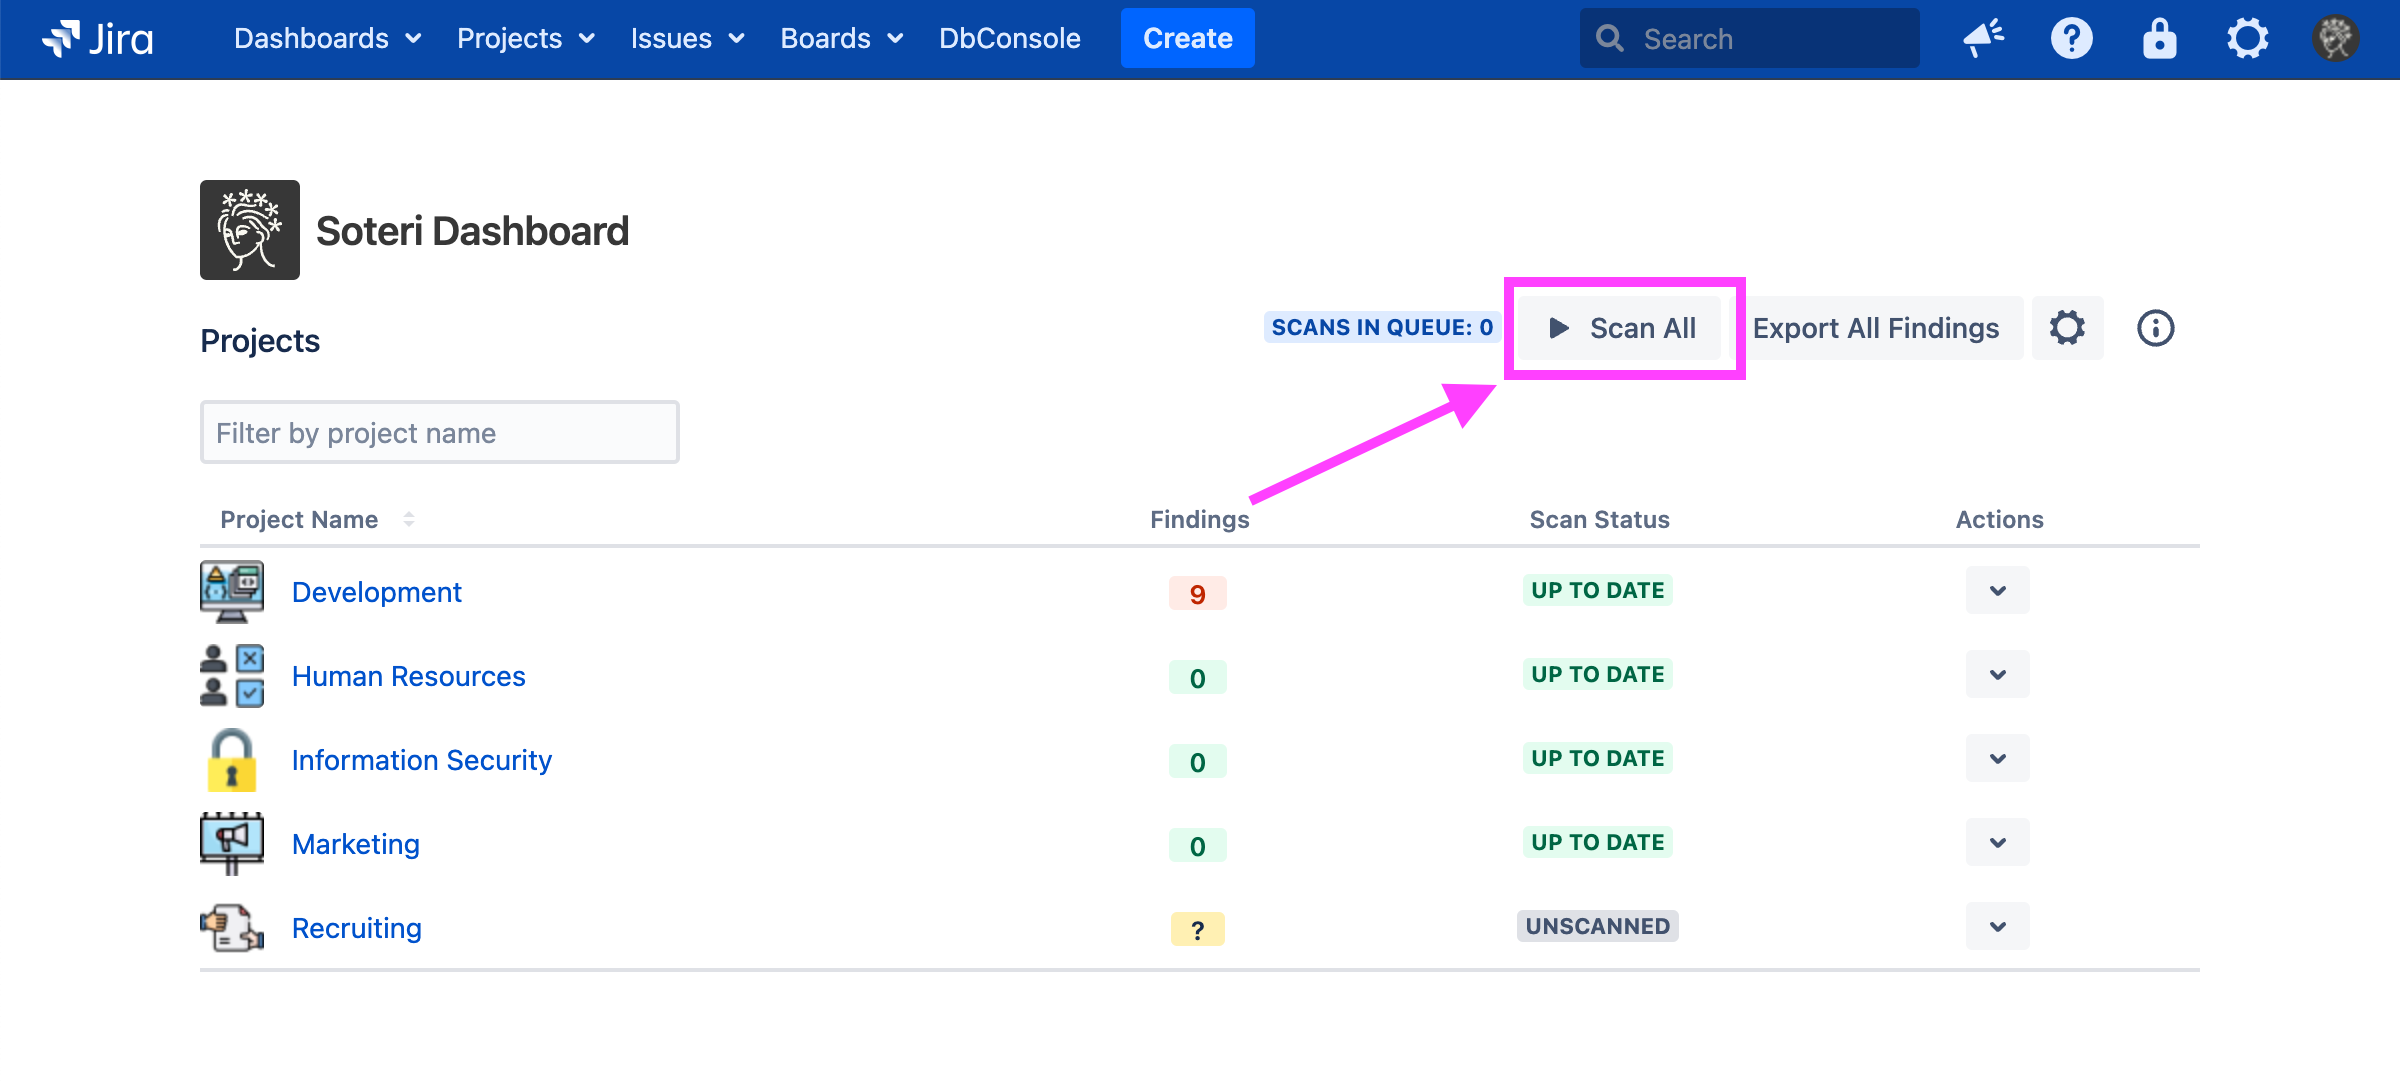
Pushing this button will trigger scans for every project in the Jira instance.
The scan queue indicator shows how many issues are waiting to be scanned: